Map brand strengths and weaknesses as perceived by LLMs, by cluster, by depth and by model.
Perception shapes brand identity, informs strategic decisions and drives customer engagement. Understanding how a brand is perceived vs. competitors uncovers competitive advantages and surfaces opportunities for improvement. This module breaks down brand perception into clusters of strengths and weaknesses, giving you a clearer view of market sentiment.
LLMs offer an unbiased, data-driven view of brands by surfacing their strengths and weaknesses. Comparing brands within a category exposes the perceived attributes that define each brand’s market presence.For example, identifying a strength like customer satisfaction enables you to leverage it in messaging and campaigns. Recognising a weakness like high pricing provides actionable insight to refine offerings and improve experiences.
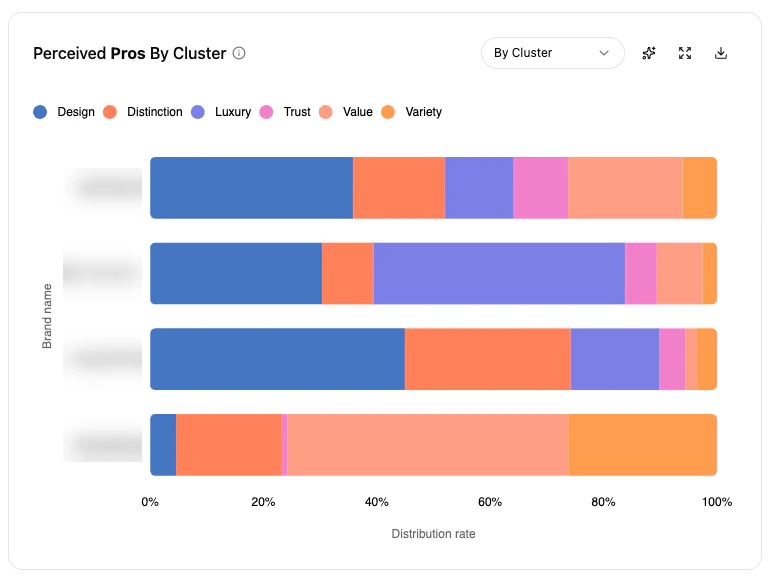
The Key Perceived Strengths chart highlights the main advantages associated with each brand as perceived by LLMs. Strengths are grouped into clusters, making it easy to spot patterns where your brand excels or falls short.Use it to:
leverage perceived strengths in marketing,
pinpoint areas for improvement,
refine offerings for competitive positioning.
Perceived Pros by cluster
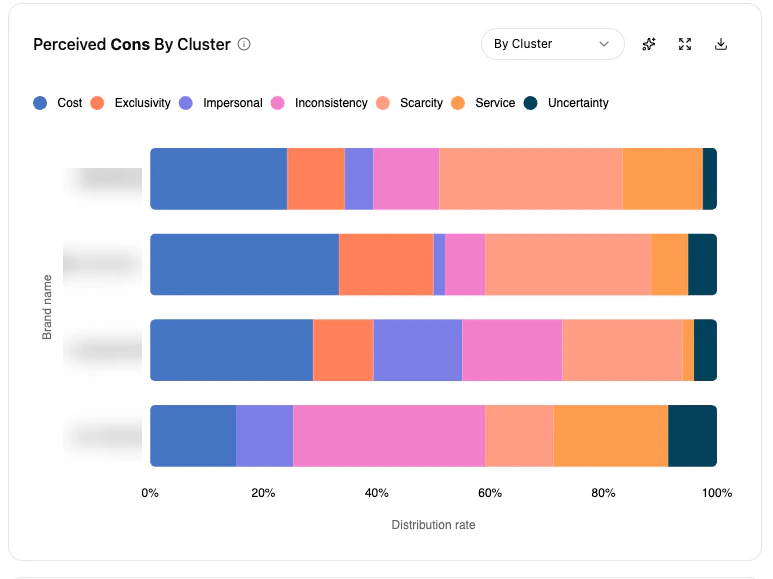
The Key Perceived Weaknesses chart compares your weaknesses against competitors as assessed by LLMs. Weaknesses are clustered around themes like product quality, customer service or pricing.Use it to:
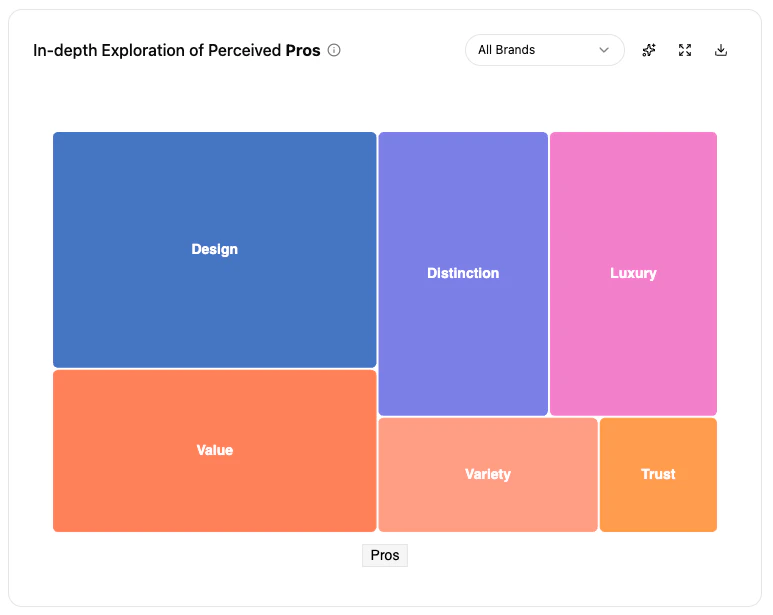
A treemap of perceived strengths. Each node is a cluster of advantages extracted from LLM responses; the node size reflects prominence.A larger node under customer satisfaction for your brand shows it is frequently recognised as a strength. A competitor may have a large node in innovation, indicating their perceived edge in that area.
Use the chart filter to isolate the perceived positives per brand (yours or your competitors’).
Positive Brand Valuation treemap
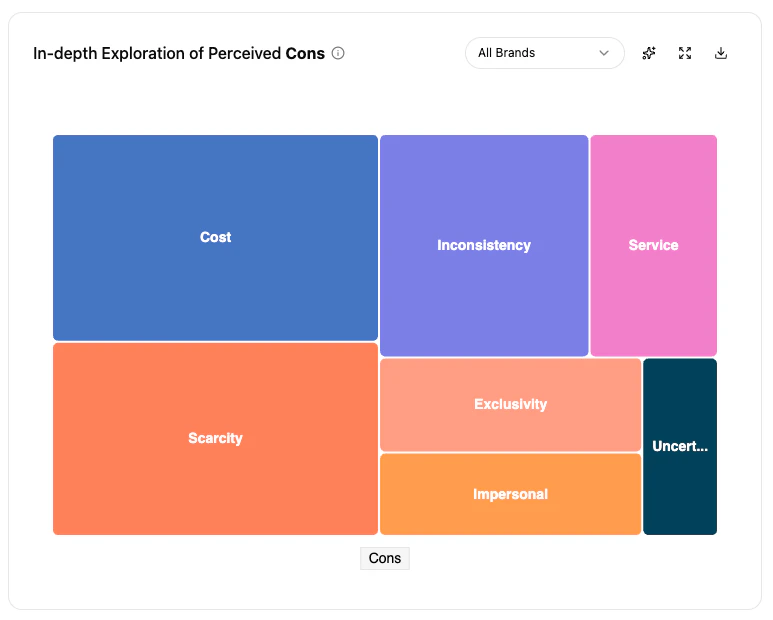
A treemap of perceived weaknesses. Larger nodes signify more frequently mentioned weaknesses; smaller ones less prominent issues.A large node for your brand under pricing indicates that high prices are a major weakness. A competitor may have a significant node for product durability.
Use the chart filter to isolate the perceived negatives per brand.
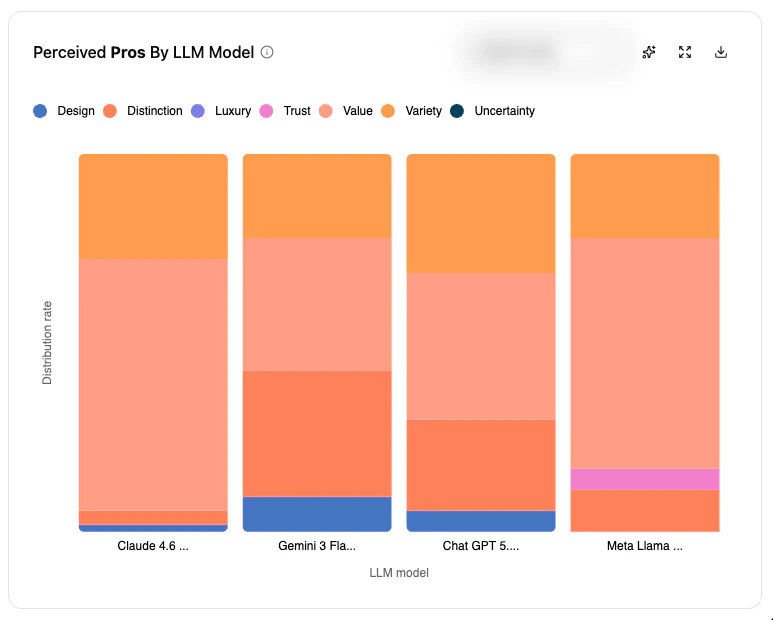
Shows how each LLM perceives your brand by displaying the percentage of each strength cluster relative to total pros attributed to the brand.A large percentage for customer satisfaction indicates strong recognition; smaller clusters signal less-emphasised strengths.
Use the chart filter to isolate strengths per brand.
Strengths by LLM model
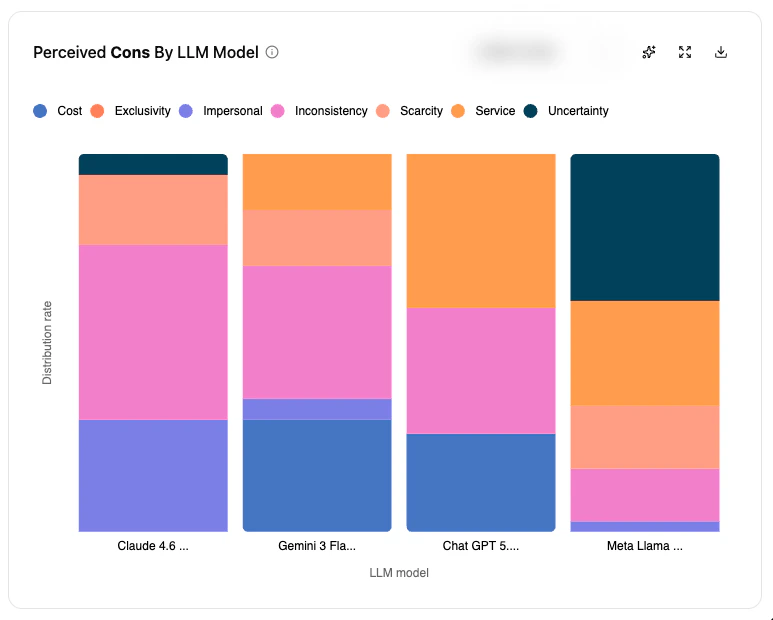
Shows how each LLM perceives your brand’s weaknesses by displaying the percentage of each weakness cluster relative to total cons.A large percentage for poor customer service flags a significant concern; smaller clusters indicate less critical issues.
Use the chart filter to isolate weaknesses per brand.