

Why awareness matters
Awareness is the foundation of brand loyalty, engagement and market share. Tracking how frequently your brand is mentioned inside LLMs reveals its prominence vs. competitors in the same category. High mention rates and share-of-voice metrics indicate strong market visibility; lower awareness signals where positioning needs work. Through charts like Average Position vs Mention Rate and Share of Voice (by model and over time), you can benchmark performance, identify visibility gaps and monitor changes in market presence over time.Interpreting the charts
Average Position vs. Mention Rate
Two complementary metrics give insight into a brand’s digital presence: the Mention Rate and the Average Position.Mention Rate
Mention Rate
Mention Rate (%) quantifies how often a brand appears in the top 25 results returned by LLMs for a specific category. It represents the frequency of a brand’s presence relative to its competitors, expressed as a percentage.Example: a brand appearing 15 times out of 100 searches in the top 25 results has a Mention Rate of 15%. The metric benchmarks visibility — how often a brand is recognised relative to competitors.
Average Position
Average Position
Average Position is the mean rank of a brand within the top 25 results when it appears. If a brand appears at positions 3, 10 and 15 in various searches, the average position is the sum of positions divided by the number of times it appears.A lower value means a stronger presence near the top of the results — greater relevance or authority within the category.
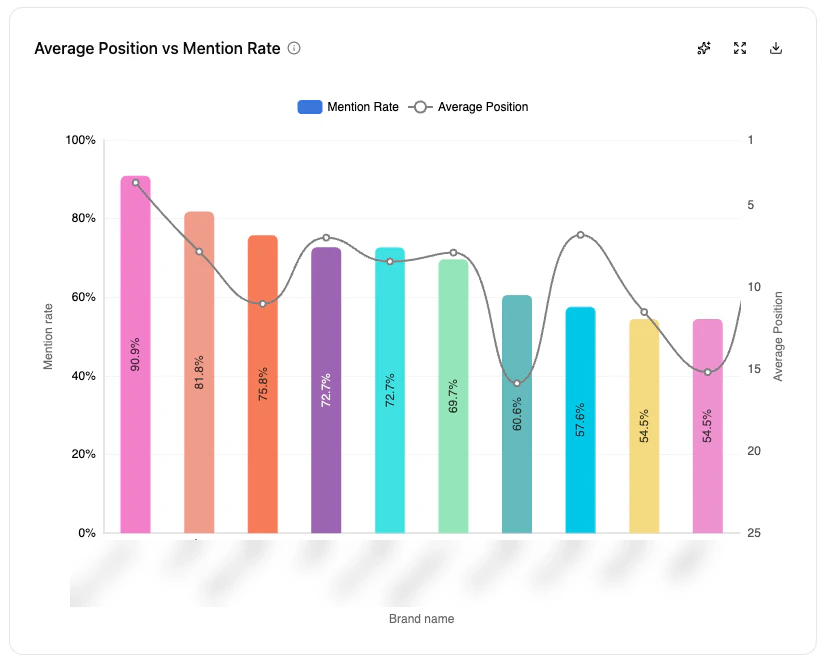
Average Position vs Mention Rate chart
Share of Voice by Model
The chart combines Brand Mention Rate and Average Position to show your brand’s standing relative to competitors across LLMs. Share of Voice focuses on the top 10 most visible brands, providing a clear benchmark.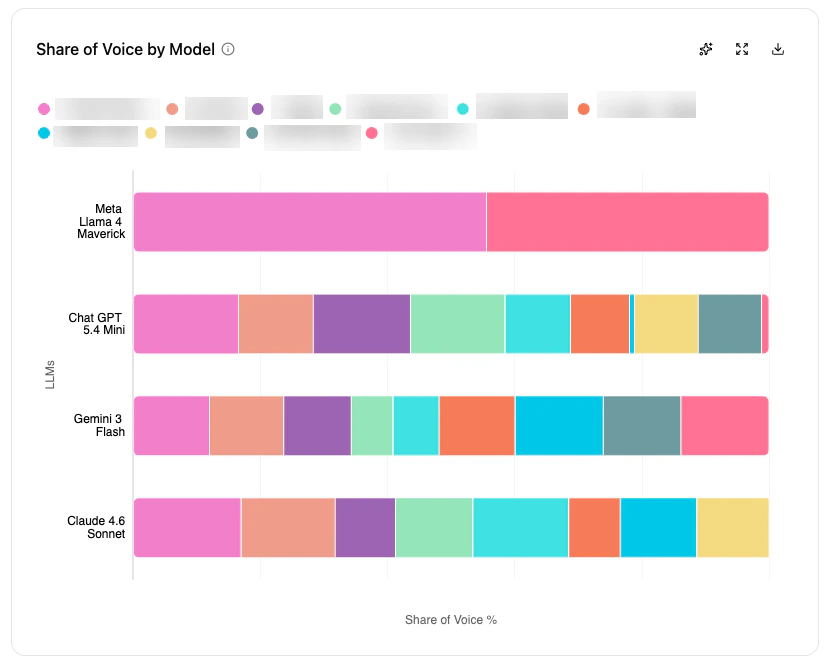
Share of Voice by Model
- Y-axis — weighted Share of Voice (%).
- X-axis — ranked brands.
Share of Voice over time
Tracks weighted Share of Voice for key brands, combining Brand Mention Rate and Average Position to reveal trends and shifts.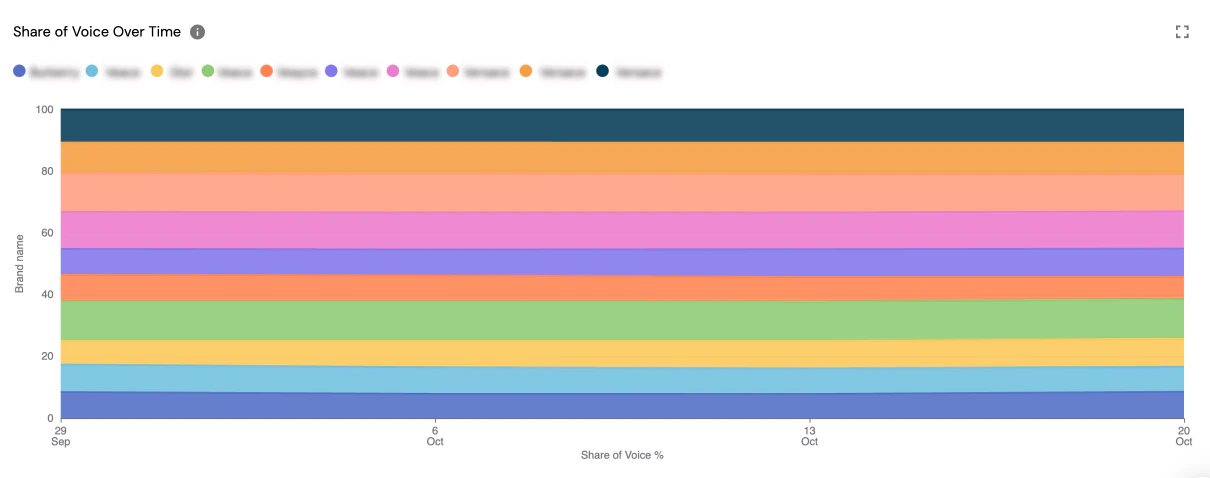
Share of Voice over time
- X-axis — weighted Share of Voice (%).
- Y-axis — time.
What’s next
Pros & Cons
Move from awareness to perception.
Key Attributes
Per-attribute brand-vs-competitor perception scoring.